I had my first taste of data reporting and visualisation around 2008 or 2009.
We had just installed a bit of software at a client that could, in theory, track their printing and copying. We built an output management and reporting system out of a few cobbled together bits of software.
Initially I had tried to build reports for the client using Crystal Reports. It was an exercise in frustration.
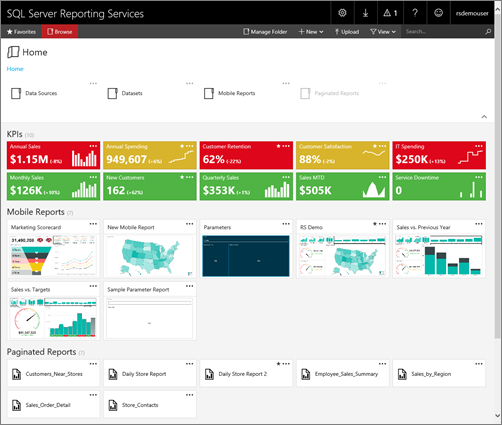
I subsequently got turned onto using SQL Server Reporting Services, and it was like a light went on somewhere.
I was able to do so much more, so much quicker than before. The reports were simple, but it displayed the information using tables and charts. It wasn’t pretty, but it worked.
I had almost insisted on SSRS being installed everywhere. Even though I had only just scratched the surface, I could see the potential. I wanted to build a report for everything. If it was in a database, I wanted to find a way to report on it.
My SQL skills didn’t match the potential, but it had room for growth.
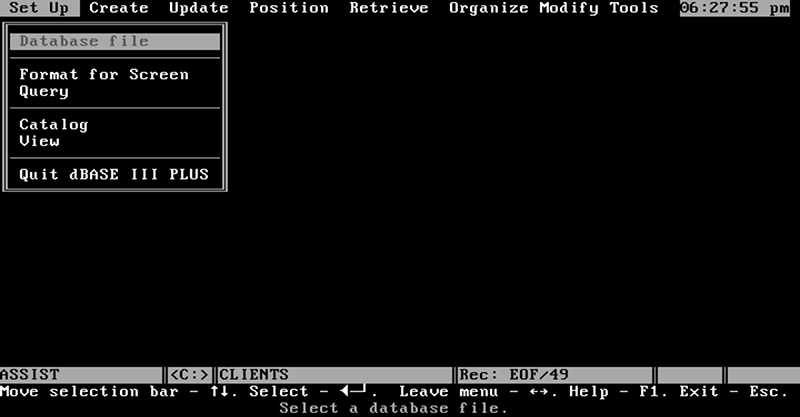
This is a long way from the first DBMS I used in 1993. DBase III. Market leader at the time. Shrouded in mystery. For a 17-year-old computer enthusiast this was ground-breaking stuff, even though I was not allowed to get into the nuts and bolts.
Little did I know back then that I would eventually one day want to pursue a career involving databases. I’m not crazy about putting the data into the database, but give it to me, and I’ll find seventeen different ways to fail at pulling it out, and maybe one way of getting a decent dataset, and I might also even visualise it for you.
The world is currently awash with data, and not everyone knows what to do with it. They know there is valuable information residing there, if only they can see it in a way that makes sense. Right there is where I want to get into the thick of things. Helping people make sense of the data they have.